
Analyzing how users interact with your website provides valuable information about how to improve the site’s performance. Google Analytics, the one we use most often, provides a lot of data, but you need to interpret that data within the context of your overall goals, and objectives set for each page. Let’s look at some examples of the metrics to watch for different purposes.
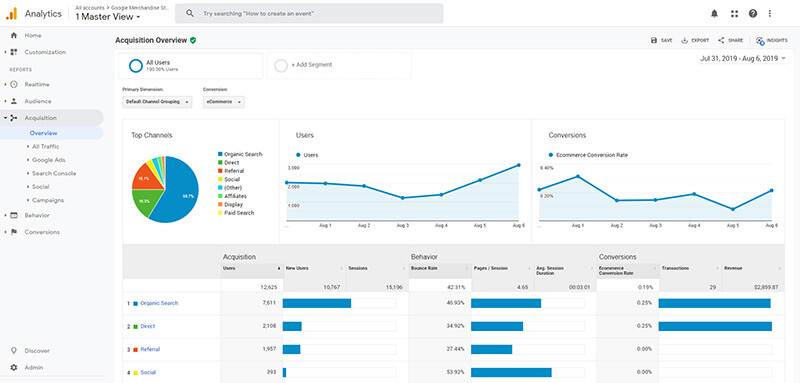
Acquisition: The acquisition data tells you how people found your site. By measuring changes between before and after time periods, this metric will tell you if a tactic worked. For example, if you’ve optimized your site for search engines (SEO), then your organic search numbers should be up. If you’ve had an ad running on a couple of social media platforms, your social media numbers should be up. If you’ve sponsored an event, attended a trade show, or engaged in some other marketing to get your name and URL out there, your “direct” numbers should be up. In all of these cases, you’d also expect your “new user” numbers to have grown. If your goal is to increase new users, you can also compare the metrics for each method of acquisition.
Behaviour: The behaviour data tells you where people go on your site, i.e. which pages they visit, how long they stay on a page, and which pages they leave from. This information can be used in several ways. For example, the pages where people spend the most time, are the pages that people are most interested in, and vice versa. Let’s say you sell jewellery and two years ago, you had a big run on Bangles. In the last year though, only 1% of visitors even clicked on the Bangles tab. That could be telling you that bangles are out of fashion, OR, it could be telling you that the younger generation don’t know what a bangle is. What do you do? Move the product listings to the Bracelets page, and delete Bangles from your menu.
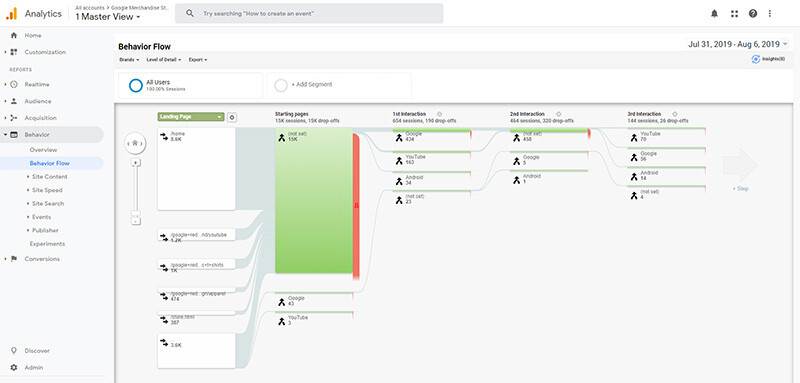
Here’s another example. Let’s say you’ve put a sale on bracelets and done a bunch of advertising or digital marketing. The behaviour data shows that you’ve had a huge increase in visitors to the bracelets page, but the “Bounce” rate for that page has also increased dramatically. (The bounce rate is the number of people who leave your site from that page.) So, they came to the bracelets page, spent a minute or two on the page, and then left the site. That could be telling you that there’s a technical problem on the page; but if that’s not the case, then chances are that no one was impressed with your discounts.
Behaviour stats can also tell you if people are actually reading your blog (time on page), if your name or keywords are misleading (bounce rate from Home page), or if your shipping rates are too high (high exit rate from shipping rate page).
Audience: the audience report tells you three things: 1) when most visitors come to your site; 2) where those visitors are; and, 3) the type of device they are using. When visitors come to your site is an interesting metric. For example, if you post a weekly blog, is the posting date related to visitor traffic? Conversely, if that just happens to be when homeowners are most often looking for the paint you sell, that might be a great time to offer a one-day sale.
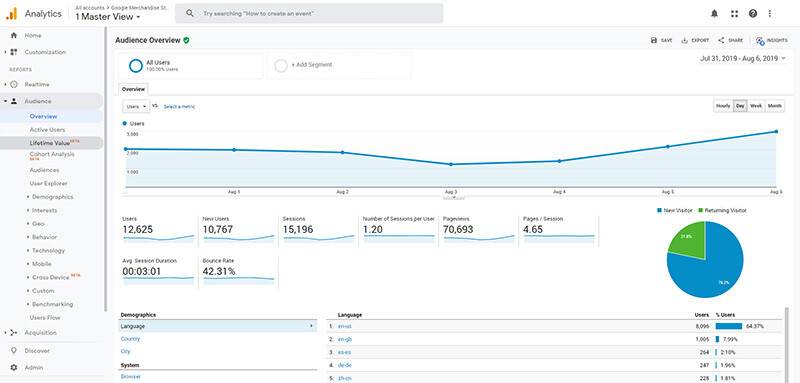
Where visitors are located is another bit of information that you can use to grow your customer base. For example, if you have mainly catered to locals in the past, but see a lot of regional or national interest, you might want to look at options for shipping to those locations.
Type of device used to be something we looked at regularly, but these days, it’s certainly best to ensure that your website adapts to any size of device.
If we’re running any advertising for you, we’re already keeping a close eye on those metrics, but if not, give us a call to get analytics set up. It’s definitely worth the small investment to make sure your web design is optimized.